Travel booking conversion: from itinerary page to booked trip
Travelers read your itinerary pages and leave without booking. What stops them between interest and a booked trip, and what to change first, with one operator’s A/B test as evidence.
- Travelers rarely leave an itinerary page over price alone. They leave because they cannot tell which trip fits their dates, fitness level, budget and must-sees without comparing pages by hand.
- A booking passes four questions in order. Which trip, is it right for me, can I trust this operator, what happens when I book. Fix the earliest one your site leaves unanswered.
- The traveler who books is a returning planner. The average path to purchase is 71 days (Expedia Group and Luth Research, 2023), and a static site treats every return as a first visit.
- Measure booked trips and revenue per visitor against a control group. Yapa Explorers booked 24% more trips in a 30-day A/B test (5.05% against 4.06%) and earned $4.27 more per visitor.
Travelers rarely leave an itinerary page because of price alone. They leave because they cannot tell which trip fits their dates, fitness level, budget and must-sees without comparing pages by hand, and because a high-consideration purchase takes several visits that a static site treats as the first one every time. The fix is to help them choose, recognize the returning planner, and measure booked trips and revenue per visitor against a control group.
The evidence in this article comes from one operator that tested exactly that. Yapa Explorers, a Machu Picchu tour operator in Peru, ran a 30-day A/B test with a 50/50 split. The control group booked at 4.06%. The group that was guided to a best-fit tour booked at 5.05%, which is 24% more trips booked, and revenue per visitor rose from $40.45 to $44.72.
One note on scope. The conversion event here is a completed booking on your own website, reported next to revenue per visitor as a separate figure. Enquiries for tailor-made trips are a different event with a different value, and they are kept out of every number below.
Why interested travelers leave the itinerary page
A visitor on an itinerary page has already told you something a homepage visitor has not: this destination, this kind of trip, roughly this budget. The interest is real. What the page usually cannot tell them is whether this trip is the right one out of the five you sell, and that is the question they came with.
The research behavior behind a trip is long and wide. Expedia Group and Luth Research (2023) found that travelers view 141 pages of travel content on average in the 45 days before booking, and that the average path to purchase is 71 days. Your itinerary page is one of those 141 pages. A traveler who cannot tell which trip fits will not ask you; they will open another tab.
The other tab is often a marketplace. Arival’s State of Experiences survey of 5,664 operators, reported by PhocusWire in February 2026, attributes 37% of tour and activity bookings to online travel agencies in 2025, up from 33% in 2024 and 28% in 2023. Over the same year the share booked on operators’ own websites fell from 29% to 25%. A traveler who leaves your itinerary page to “keep researching” may still book your trip, through a channel that takes a commission, or book someone else’s.

Price is the explanation most teams reach for first, and it is the hardest one to prove. A visitor who compared your price with a competitor’s and left looks identical in analytics to one who could not work out whether the four-day trek needs more fitness than they have. Before you discount, separate a traffic problem from a website problem, then look at where on the path the interested visitors stop.
The four questions a traveler answers before booking
Between an itinerary page and a booked trip, a traveler works through four questions, in this order: which trip, is it right for me, can I trust this operator, and what happens when I book. Each one belongs to a stage of the journey. A traveler stuck on the first question gets nothing from a cancellation policy, and one stuck on the fourth gets nothing from a destination film.
The framework is a diagnostic. For each question, there is a recognizable way the path stalls, a kind of content that answers it, and a behavior you can read in your own analytics to see whether that is where your visitors stop.
| Traveler’s question | How the path stalls | What answers it | What to look for in your data |
|---|---|---|---|
| Which trip? | Compares trip pages by hand, then leaves to research elsewhere | A guided choice: a few questions that route to one or two itineraries | Sessions with several itinerary pages viewed and no booking started |
| Is it right for me? | Cannot confirm dates, days needed, fitness level or total cost | Hard constraints stated at the top of the page, not in a PDF or a tab | Long time on one itinerary page, exits from the details or price section |
| Can I trust this operator? | Leaves to read reviews on another site and does not come back | Traveler reviews, guides, group size and inclusions, shown at the moment of hesitation | Return visits to the same trip without progress toward booking |
| What happens when I book? | Starts the booking and stops at payment or traveler details | Deposit, changes, cancellation and next steps, answered next to the button | Bookings started against bookings completed |
Two things make this harder on a travel site than in most online stores. The constraints are personal and non-negotiable: a traveler with six days cannot take a nine-day trip at any price. And the same page gets all four questions at once, from different visitors, which is why one static layout tends to serve one of them well and the others badly. The same logic applies to any visitor who is interested but not ready to commit: the next step has to match where they are.
Help them choose: guided selection beats comparison
A traveler who cannot tell which trip fits will not ask you; they will open another tab.
The first question is where a multi-trip operator loses the most interested visitors, and it is the one a catalog layout answers worst. Guided selection replaces “here are our tours” with a short sequence of questions that works like a conversation with a travel consultant: each answer removes the trips that do not fit, and the traveler ends on one itinerary with a reason it suits them.
- Matches the answers given
- Removes the trips that do not fit
- Links straight to the trip and its booking path
Yapa Explorers is a useful example because its catalog is not large. Its case study describes tours that differ by starting point, physical activity level, destinations included and duration, with no choice that is obviously correct for someone who has never been to the region. Visitors had to decide between train and hike before knowing what that meant for cost, duration or fitness. They browsed several tour pages to piece it together, and many left to keep researching elsewhere.
The build is short if you start from the decisions, not from the catalog:
- List the decisions that split your trips. For Yapa these were how to reach Machu Picchu, days available, the kind of experience wanted and extra landmarks.
- Order them by how hard the constraint is. Days available and physical level come before preferences, because they rule trips out completely.
- Map every answer path to one best-fit itinerary. If two paths end on the same trip, one of the questions is not doing any work. Remove it.
- Say why it fits. The result repeats the traveler’s own answers back, so the recommendation reads as a conclusion they reached.
- Link the result straight into the trip and its booking path. A recommendation that ends on the catalog page has undone its own work.
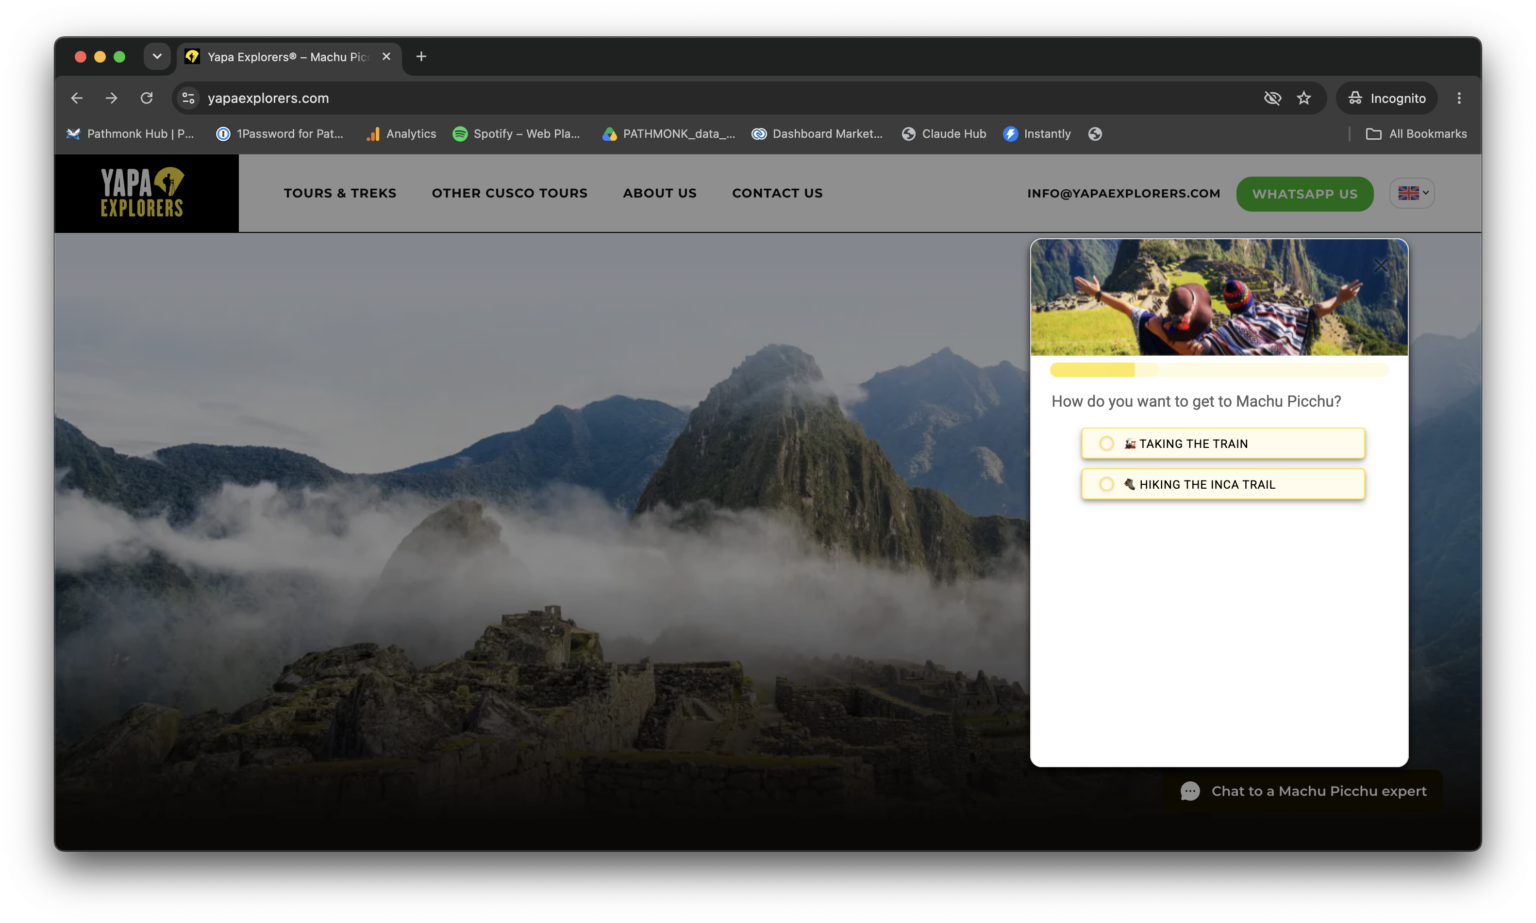
Common mistake: answering indecision with more information. Longer itinerary pages, a comparison table with twelve rows and a downloadable brochure all add reading to a visitor whose problem is that there is already too much to compare. The fix for a choice problem is fewer options, reached by the traveler’s own answers.
Guided selection handles the first question. The other three are answered by what the page shows at each stage, which is the job of intent-based personalization: value and trust content for early explorers, and a more direct path into the selector and the reservation flow for visitors who show high intent.
Recognize the returning planner
A 71-day path to purchase means the person who books is almost never on a first visit. They came once to look, again to compare, and again with a partner or a calendar open. A static site gives all three visits the same hero image and the same list of trips, so the visit that is closest to a booking is spent finding the page they were already on.
Device behavior points the same way. In Contentsquare’s 2026 Digital Experience Benchmarks, desktop visitors to travel and hospitality sites viewed 6.8 pages per session against 5.0 on mobile, and spent 8 minutes against 3 minutes 23 seconds. That is consistent with quick checks on a phone and the long comparison at a desk. A site that reads each visit in isolation sees a string of short, unrelated sessions. The traveler experiences one long decision.
Recognizing the returning planner does not require a login or a third-party cookie. Pathmonk’s cookieless tracking creates a unique first-party identifier for each visitor, so the same visitor can be recognized across sessions, and reads behavior within each visit to estimate the stage they are in. What changes on a return visit is the layer around the itinerary: the proof shown, the question answered, the next step offered. The itinerary content itself stays the same.
In practice, three things are worth changing for a returning planner:
- Where they land. Offer a way back to the trip they viewed, or into the selector, before the full catalog.
- What proof they see. A first visit earns the route and the day-by-day plan. A return visit earns reviews, group size and what is included.
- What you ask for. A visitor back for the third time on the same trip is ready for booking questions, such as what happens after they book and whether the tour can be changed.
Recognition works per browser. A traveler who researches on a phone and books on a laptop is two visitors until they identify themselves, for example through a form. Treat cross-device journeys as undercounted, and do not read a low return rate as proof that travelers decide in one visit.
What Yapa Explorers changed, and what happened
Yapa Explorers sells Machu Picchu experiences, from classic train tours to multi-day treks through the Sacred Valley, directly to independent travelers who research and book online. The marketing team had strong intent and budget, and a site that left each visitor to match their own logistics to the right tour. They wanted to route undecided visitors to a best-fit tour without redesigning the site or buying more traffic.
Pathmonk added a guidance layer on top of the existing website. Setup ran through Google Tag Manager, with no development work and no cookies. Three things went live:
- Product Selector. Guided questions on train or hike, days available, the kind of experience wanted and extra landmarks, routing each visitor to a best-fit itinerary.
- Intent-based microexperiences. Value and trust content for early explorers, and a more direct path into the selector and reservation flow for high-intent visitors. Full Image Micro Experiences added full-size photos and video.
- A revenue pixel. It tracked completed bookings and the exact value of each purchase, so revenue was measured and not estimated.
The test was a 50/50 split over the same four-week window: half of the traffic saw the standard website, half was guided through the Product Selector and microexperiences. Both groups came from the same sources at the same time, which is what lets the difference be attributed to the on-site experience and not to season or campaigns.
In 30 days the Pathmonk group booked 24% more trips than the control group: a booking rate of 5.05% against 4.06%. Revenue was $129.3K against $116.7K, a 10.55% revenue uplift, and revenue per visitor rose by $4.27, from $40.45 to $44.72. The case study counts 29 incremental bookings worth $12,335 in incremental revenue.
The impact was not even across the journey. Measured per funnel stage, Pathmonk group against control group, the case study reports +2% at the awareness stage, +25% at consideration and +14% at decision. The largest effect sits where the first two questions are asked: which trip, and is it right for me.
Eric Nguyen, AI and Product Lead at Yapa Explorers, describes the change this way: “Pathmonk turned our static website into a dynamic experience. Their AI personalizes the journey for every visitor, and conversions improve quickly.”
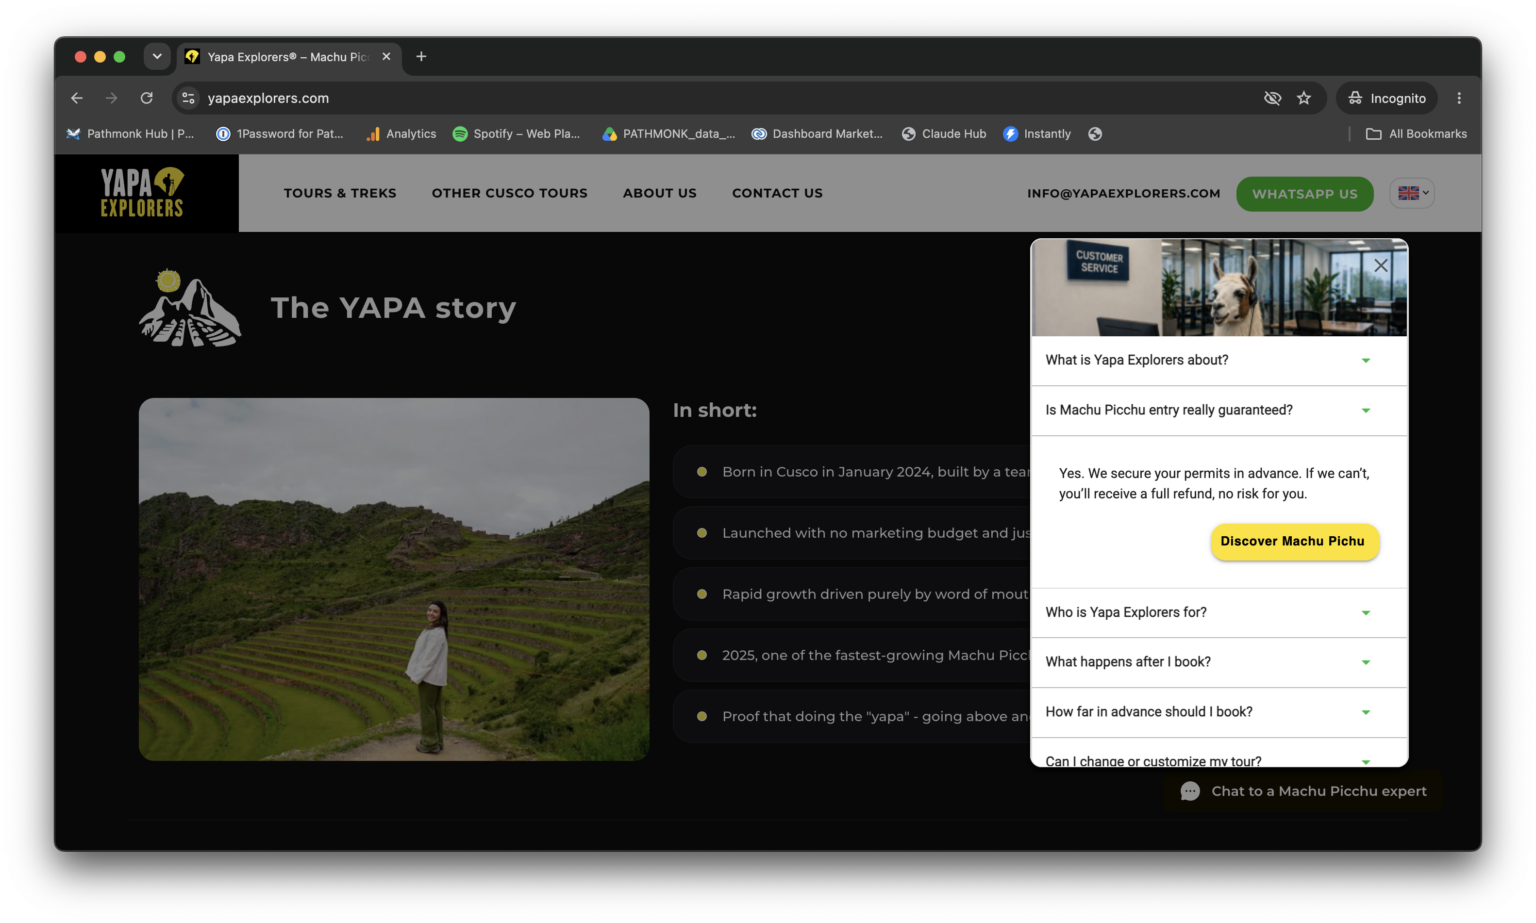
The same operator also appears in Pathmonk’s AI search results page, with +21% traffic from AI search over months 1 to 3. That is an acquisition figure from a separate measurement, and it is not part of the booking test above.
The math: bookings and revenue per visitor
The Yapa result contains a detail that every travel marketer should look for in their own tests. Trips booked rose 24%. Revenue rose 10.55%. Those two numbers are both correct, and the gap between them is the reason booking rate should never be reported alone.
Revenue per visitor is booking rate multiplied by the average value of a booking. Dividing the published revenue per visitor by the published booking rate gives the value per booking in each group:
| Figure | Control | Pathmonk | Change |
|---|---|---|---|
| Booking rate (published) | 4.06% | 5.05% | +24% |
| Revenue per visitor (published) | $40.45 | $44.72 | +$4.27 |
| Value per booking (derived) | $996.31 | $885.54 | About 11% lower |
| Visitors per group (derived) | About 2,900 | About 2,900 | 50/50 split |
The case study gives the reason for the lower value per booking: the Product Selector unlocked bookings from travelers who would otherwise have left to keep researching, many of them entering through Yapa’s more accessible tours. More people booked, a larger share of them booked a lower-priced trip, and the site still earned $4.27 more from every visitor it received.
Revenue per visitor is also the figure that connects to your media budget. Every visitor has an acquisition cost, and the test shows what each one returned with and without guidance. To size it for your own site, multiply the change in revenue per visitor by the visitors exposed. Hypothetical example An operator with 60,000 monthly visits that raised revenue per visitor by $1.00 would add $60,000 a month before any change in ad spend. Your own figure depends on your prices, your mix of trips and your traffic, which is why industry conversion benchmarks are a poor substitute for a control group, and why the business case for conversion work should be built on revenue, not on rate.
This is one operator, one destination and one 30-day window, with about 2,900 visitors per group by our arithmetic. The case study does not publish a confidence level. Read it as evidence that guided selection changes booking behavior on a multi-trip site, not as a forecast for yours.
What to fix first on your own site
Fix the earliest unanswered question first. A better booking form does nothing for a traveler who never worked out which trip to book, and a selector does nothing for one who chose a trip and then could not find the cancellation terms. The order of the four questions is the order of the work.
Start with the first check. An operator with more than a handful of itineraries should rule out the choice problem before touching anything further down the path. If visitors pass all three checks and still do not book, the page is probably not the problem: look at which campaigns and keywords are sending them, and at whether the traffic matches the trips you sell. That diagnosis belongs with the rest of your conversion rate optimization work, and it is where a travel business usually finds that paid traffic and on-site experience have to be read together.
Then measure it the way Yapa did:
- One conversion event. A completed booking, with its value. Enquiries, brochure downloads and newsletter sign-ups are reported separately and never added to bookings.
- Two figures. Booking rate and revenue per visitor, side by side.
- A control group for the whole period. Travel demand moves with season, school holidays and your own campaigns. A before and after comparison measures the calendar. A split test with both groups running in the same weeks measures the change.
- A window that fits how your travelers book. Yapa measured 30 days. If your booking window is long, a short test only counts the travelers who decide quickly, so keep the control group running.
If most of your trips are sold through enquiry and a sales conversation, your conversion event is a qualified enquiry and the booking happens offline: the four questions still hold, the measurement does not. If you sell one trip, or two that nobody could confuse, there is no choice to guide, so start at the second question. And if your site has too few bookings a month to compare two groups, fix the obvious gaps from the table by judgment and spend the effort on demand first.
Key takeaways
- Interested travelers leave itinerary pages mainly because they cannot tell which trip fits them, not because of price alone.
- Every booking passes four questions in order: which trip, is it right for me, can I trust this operator, what happens when I book. Fix the earliest one your site leaves unanswered.
- Guided selection answers a choice problem with fewer options. More itinerary detail makes it worse.
- The traveler who books is rarely on a first visit. Expedia Group and Luth Research (2023) measured an average path to purchase of 71 days.
- Yapa Explorers booked 24% more trips in a 30-day, 50/50 A/B test: a 5.05% booking rate against 4.06% in the control group.
- Revenue per visitor rose by $4.27, from $40.45 to $44.72, a smaller gain than bookings because more travelers booked accessible tours.
- Operators’ own websites took 25% of tour and activity bookings in 2025, down from 29% in 2024 (Arival, 2026). A traveler who leaves to keep researching may not come back to book direct.
- Report booked trips and revenue per visitor as two figures, against a control group, and keep enquiries separate.
FAQs on travel booking conversion
Why do visitors read our itinerary pages and leave without booking?
Mostly because they cannot tell which trip fits their dates, fitness level, budget and must-sees without comparing pages by hand, so they leave to keep researching. Price alone is rarely the reason. A trip is also planned over several visits, and a static site treats each return as a first visit instead of picking up where the traveler stopped.
What should a tour operator fix first to get more bookings?
Fix the earliest unanswered question on the path: which trip, is it right for me, can I trust this operator, what happens when I book. If visitors open several trip pages and leave, start with guided selection. If they settle on one trip and stall, add constraints and proof to the page. If they start a booking and abandon it, answer payment, change and cancellation questions next to the button.
What is a good booking conversion rate for a tour operator website?
There is no single figure that applies across destinations, prices and traffic sources. The control group in the Yapa Explorers test booked at 4.06%, which is one operator’s number and not a benchmark. The useful comparison is your own site against a control group over the same weeks, reported with revenue per visitor.
Should we measure booking rate or revenue per visitor?
Both, as two separate figures. In the Yapa Explorers test trips booked rose 24% while revenue rose 10.55%, because more travelers booked accessible tours and the average value of a booking fell. Booking rate alone would have overstated the gain. Revenue per visitor, which rose by $4.27, shows what the extra bookings were worth.
Does a trip selector lower the average booking value?
It can. In the Yapa Explorers case the value per booking, derived from the published figures, was about 11% lower in the guided group. The case study attributes the extra bookings to travelers who would otherwise have left to keep researching, many of them entering through the more accessible tours. Revenue per visitor still rose from $40.45 to $44.72, so the site earned more from the same traffic.
How long should a booking test run on a travel site?
Long enough to cover how your travelers book, with both groups running in the same weeks. Yapa Explorers measured a 30-day window with a 50/50 split. If your booking window is long, a short test only counts the travelers who decide quickly, so keep a control group running after the first read.
Should enquiries count as conversions alongside bookings?
No. A completed booking and an enquiry are different events with different values. Report them separately and never add them together. If most of your trips are sold through enquiry and a sales conversation, the qualified enquiry is your conversion event and bookings are measured offline.
- The Path to Purchase: uncovering how travelers plan and book, Expedia Group and Luth Research, published 2 Aug 2023 (hospitalitynet.org)
- Arival State of Experiences report, operator survey August to November 2025, reported 9 Feb 2026 (phocuswire.com)
- Contentsquare 2026 Digital Experience Benchmarks, travel and hospitality engagement (contentsquare.com)